Vlada
2026-08-27 · on LinkedIn ↗
Medicare Advantage prior authorization exposure by geography
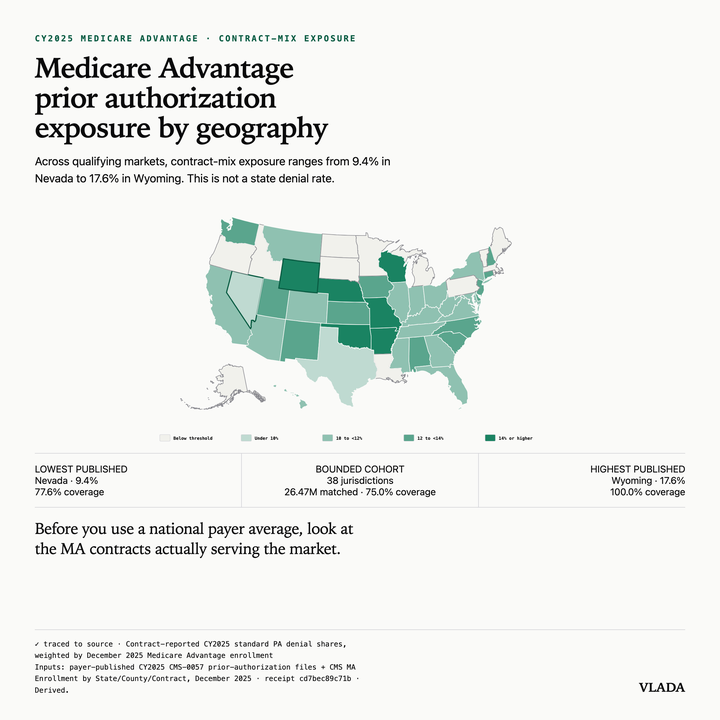
Medicare Advantage prior authorization exposure varies by geography because MA contracts are not distributed evenly across markets.
Across jurisdictions meeting our evidence threshold, enrollment-weighted exposure to contract-reported PA denial shares ranged from 9.4% in Nevada to 17.6% in Wyoming.
Why? Payers publish these metrics by H-contract, not by state. Each market contains a different enrollment mix of contracts.
We joined CY2025 payer reports to December 2025 state-county-contract enrollment. The match covers 26.47 million of 35.29 million members in numeric CMS enrollment cells, or 75.0%. We publish only jurisdictions with at least 70% coverage and 10,000 matched members. The rest are gray on the map and unranked.
If you lead a provider or health plan across markets, use the contracts actually serving each market before acting on a parent-company average.
This is not an observed state denial rate. Most contract percentages are assigned to every geography where the contract has enrollment. Enrollment is a weight, not prior-authorization request volume.
The national average is the summary. The local contract mix tells you which published rates apply to your market.
- Source
- Inputs: payer-published CY2025 CMS-0057 prior-authorization files + CMS MA Enrollment by State/County/Contract, December 2025 · receipt cd7bec89c71b
- Measure
- Contract-reported CY2025 standard PA denial shares, weighted by December 2025 Medicare Advantage enrollment