Vlada · Research · 2026-09-30 · comparative
After plans leave a county, Medicare Advantage holds up where insurers compete and shrinks where they don't
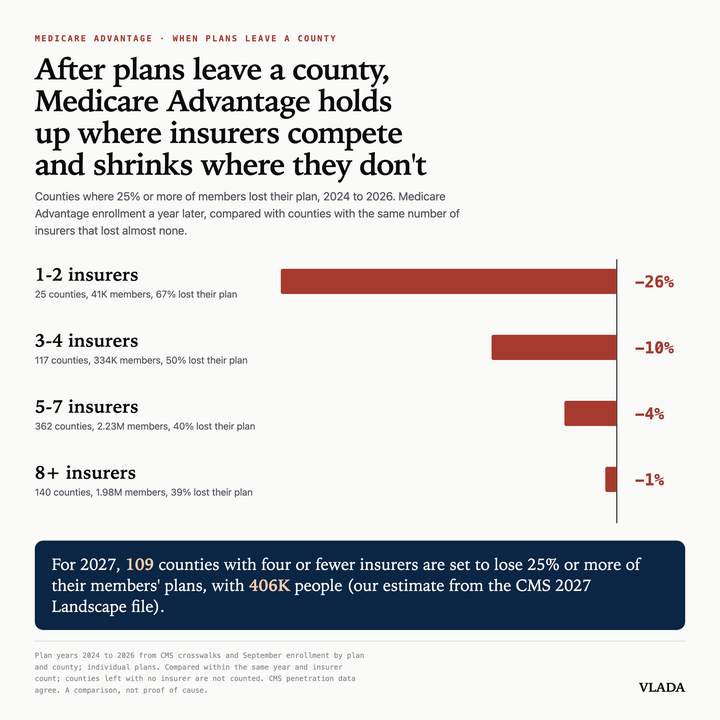
When a Medicare Advantage plan leaves a county, does the number of insurers left decide whether people stay in Medicare Advantage?
| County Medicare Advantage enrollment after heavy plan exits, by number of insurers | Value |
|---|---|
| 1-2 insurers25 counties, 41K members, 67% lost their plan | -26.3 |
| 3-4 insurers117 counties, 334K members, 50% lost their plan | -9.8 |
| 5-7 insurers362 counties, 2.23M members, 40% lost their plan | -4.1 |
| 8+ insurers140 counties, 1.98M members, 39% lost their plan | -0.9 |
Counties where 25%+ of individual-plan MA members lost their plan (stranded or terminated in the CMS crosswalk), grouped by insurers with members in the county; MA members the next September against same-year, same-insurer-count counties that lost under 5%. Cross-checked on the CMS state-county penetration file (MA share of all Medicare eligibles). · CMS plan crosswalks, CMS monthly enrollment by plan and county, CMS Landscape files CY2023 to CY2027, CMS state-county penetration files; docs/knowledge/ma/landscape-day/exits-competition/README.md (audit). · 4 rows
The posted figure
Read with
- Comparison, not proof of cause: these counties differ in other ways too.
- Mostly a rural effect; in counties with 5,000+ members the gap nearly disappears.
- The one-or-two-insurer group is small (25 counties); size varies by year (-11% in 2025, -63% in 2026 before excluding counties left with no insurer).
- Where people went (Original Medicare, a supplement plan, PACE) is not measured person by person.
- 2027 is an estimate until the CMS crosswalk in October.
- Corrected 2026-09-29: Los Angeles was double-counted in the 2024 and 2025 bases; the fix moved the 8+ insurer group from +2% to about -1% and left the other groups unchanged.
Ask about this view