Vlada · Research · 2026-09-10 · derived
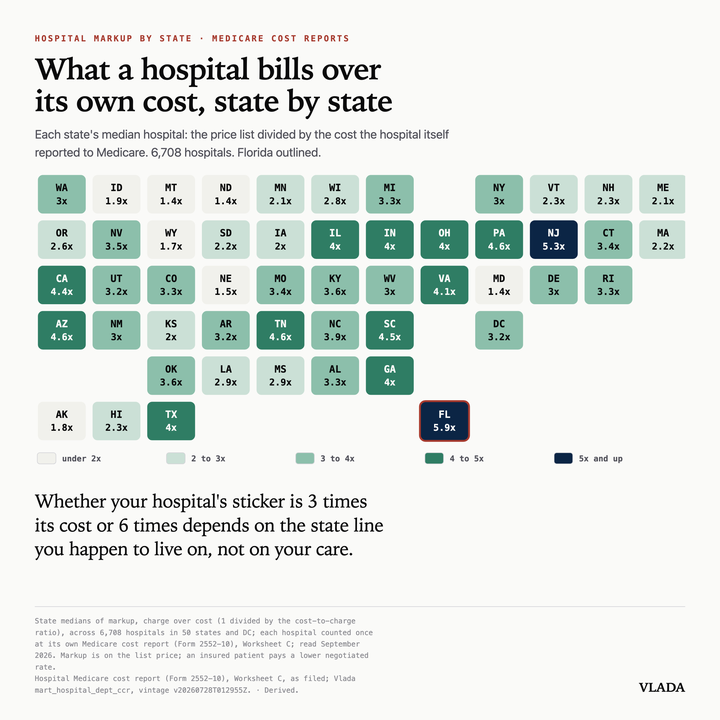
In Florida, a typical hospital charges 5.9 times what its care cost. In North Dakota, 1.4 times.
How far a hospital's bill sits above its cost, state by state
| 6,708 US hospitals | x |
|---|---|
| Floridan=247 | 5.9 |
| New Jerseyn=86 | 5.3 |
| Arizonan=108 | 4.6 |
| Texasn=531 | 4 |
| North Dakotan=46 | 1.4 |
| Montanan=57 | 1.4 |
| Marylandn=58 | 1.4 |
State medians of markup, the price on the bill over what the care cost (1 divided by the cost-to-charge ratio), across 6,708 hospitals in 50 states and DC; each hospital counted once at its own Medicare cost report (Form 2552-10), Worksheet C; read September 2026. The markup is the price on the bill; an insured patient pays a lower negotiated rate. · Hospital Medicare cost report (Form 2552-10), Worksheet C, as filed; Vlada mart_hospital_dept_ccr, vintage v20260728T012955Z. · 7 rows
The posted figure
Read with
- This is the price on the bill, what the price list charges, not what an insured patient pays. A plan pays a negotiated rate, and it is lower.
- Markup is the hospital's own charge over its own reported cost. It is not profit; what a hospital charges and what it collects are different numbers.
- Cost comes from the hospital's Medicare cost report, one overall figure per hospital per year. It is the hospital's own accounting, not an independent audit.
- Each state figure is the median of the hospitals in it; every state also has hospitals well above and well below its median.
- Each hospital counts once, at its latest available report. 5,665 of 6,708 reports are from fiscal 2023 or later; some are older.
- State differences reflect a mix of policy, ownership, case mix and local market structure, not one cause. Maryland's low markup is consistent with its all-payer rate setting, but the map does not by itself prove why any single state sits where it does.
Ask about this view
3 days free · then $99 a month